Technical Indicator

UT Bot

The UT Bot indicator is a powerful tool that aids traders in identifying potential buy and sell signals based on the Average True Range (ATR) and a custom trailing stop mechanism similar to the Super Trend indicator. Here’s an in-depth look at how this indicator works and how it can be beneficial for your trading strategy.

Overview

The UT Bot indicator is designed to help traders make informed decisions by providing clear buy and sell signals. The indicator leverages the ATR to determine the volatility of the asset and sets trailing stops accordingly.

*UT Bot indicator applied to a 1-minute chart of the SPDR S&P 500 ETF (SPY)

Key Features:

  1. Key Value and ATR Period Inputs:
    • keyvalue: Determines the sensitivity of the trailing stop.
    • atrperiod: Sets the period for calculating the ATR.
  2. ATR Calculation:
    • xATR: Calculates the ATR based on the specified period.
    • nLoss: Computes the loss value by multiplying the key value with the ATR.
  3. Trailing Stop Logic:
    • The trailing stop is dynamically adjusted based on the price movements and the calculated loss value. It uses conditional logic to update the trailing stop levels.
  4. Position Detection:
    • The indicator identifies the current position (buy or sell) based on crossovers and crossunders of the price with the trailing stop level.
  5. Visual Representation:
    • The trailing stop levels are plotted on the chart with different colors indicating buy (green) and sell (red) signals.
    • Buy and sell signals are marked on the chart using labels.
  6. Alerts:
    • Alerts are set up for buy and sell conditions to notify traders of potential trade opportunities.
*UT Bot indicator applied to a 1-day chart of the SPDR S&P 500 ETF (SPY)

More On The UT Bot Indicator:

The UT Bot indicator is a versatile tool for traders. By incorporating ATR-based trailing stops and clear buy/sell signals, this indicator can be a valuable addition to your trading toolkit. Experiment with the sensitivity and ATR period settings to optimize the indicator for your specific trading strategy and asset.

Manually testing settings takes a lot of time and instead of this, we coded this indicator into a strategy and backtested over 2,000 different setting combinations. See the results in our backtest report.

Resources:

Research, Plan and Trade with algoHunt

Sign up today to get new strategy notifications & free access to the backtest library.

Strategy & Backtesting

We coded this indicator into a custom strategy and then we backtest it to get an idea of performance.

Strategy | UT Bot

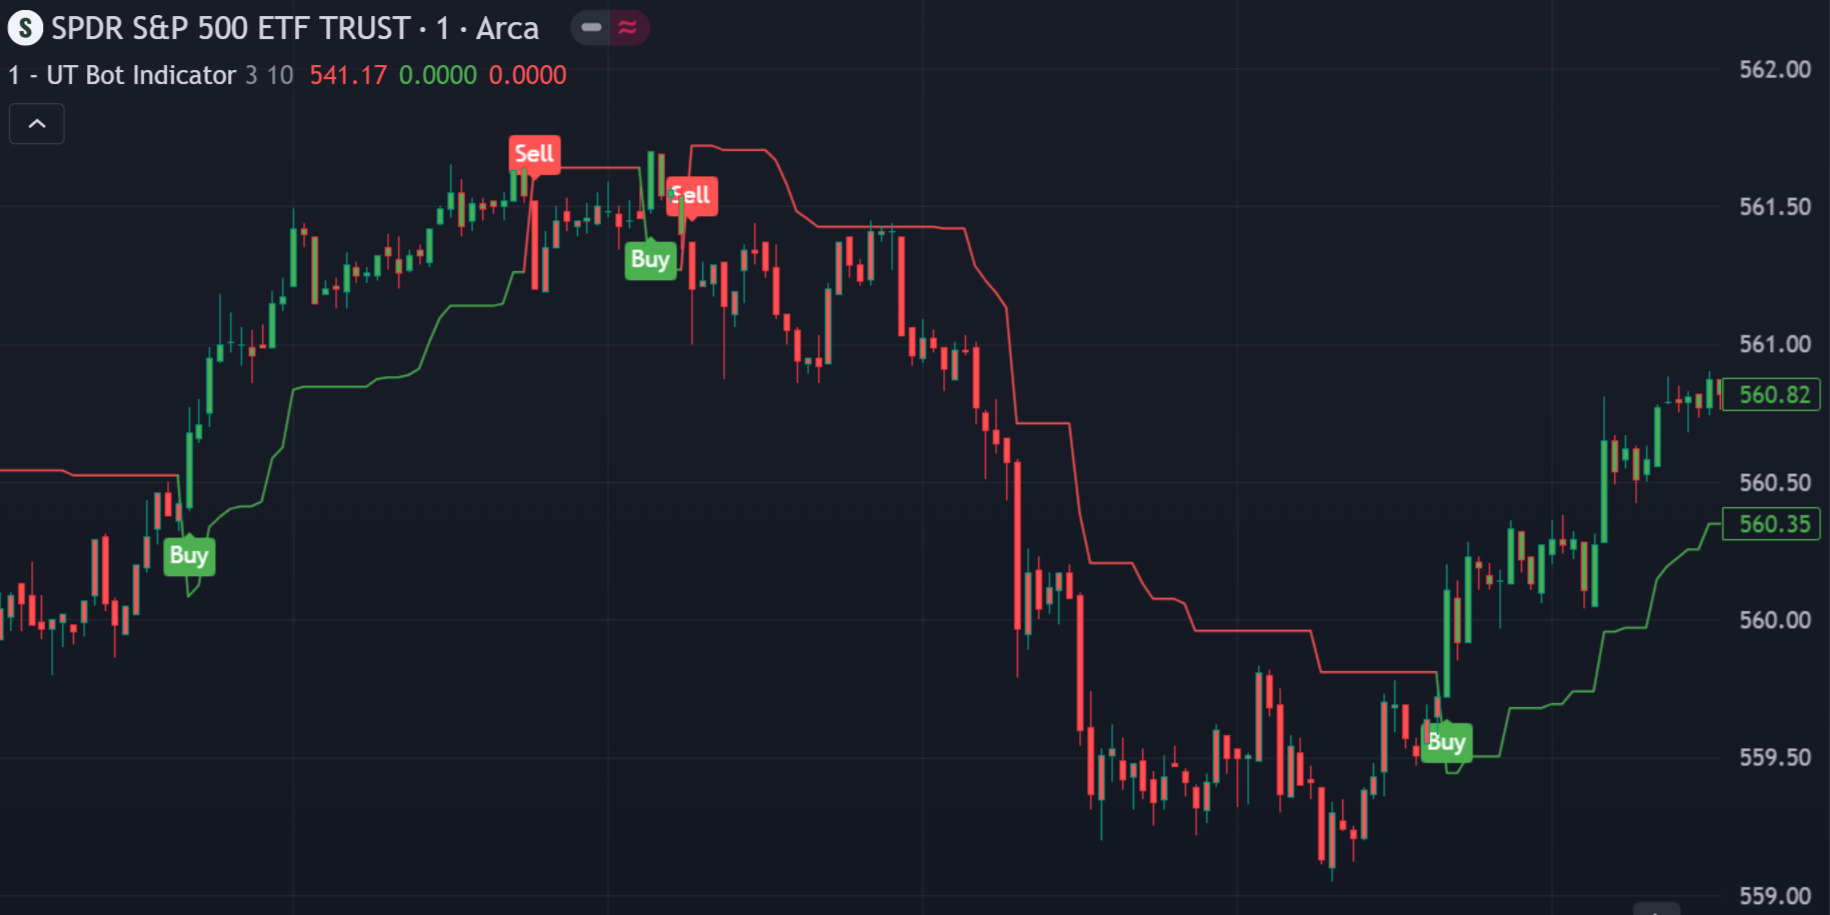
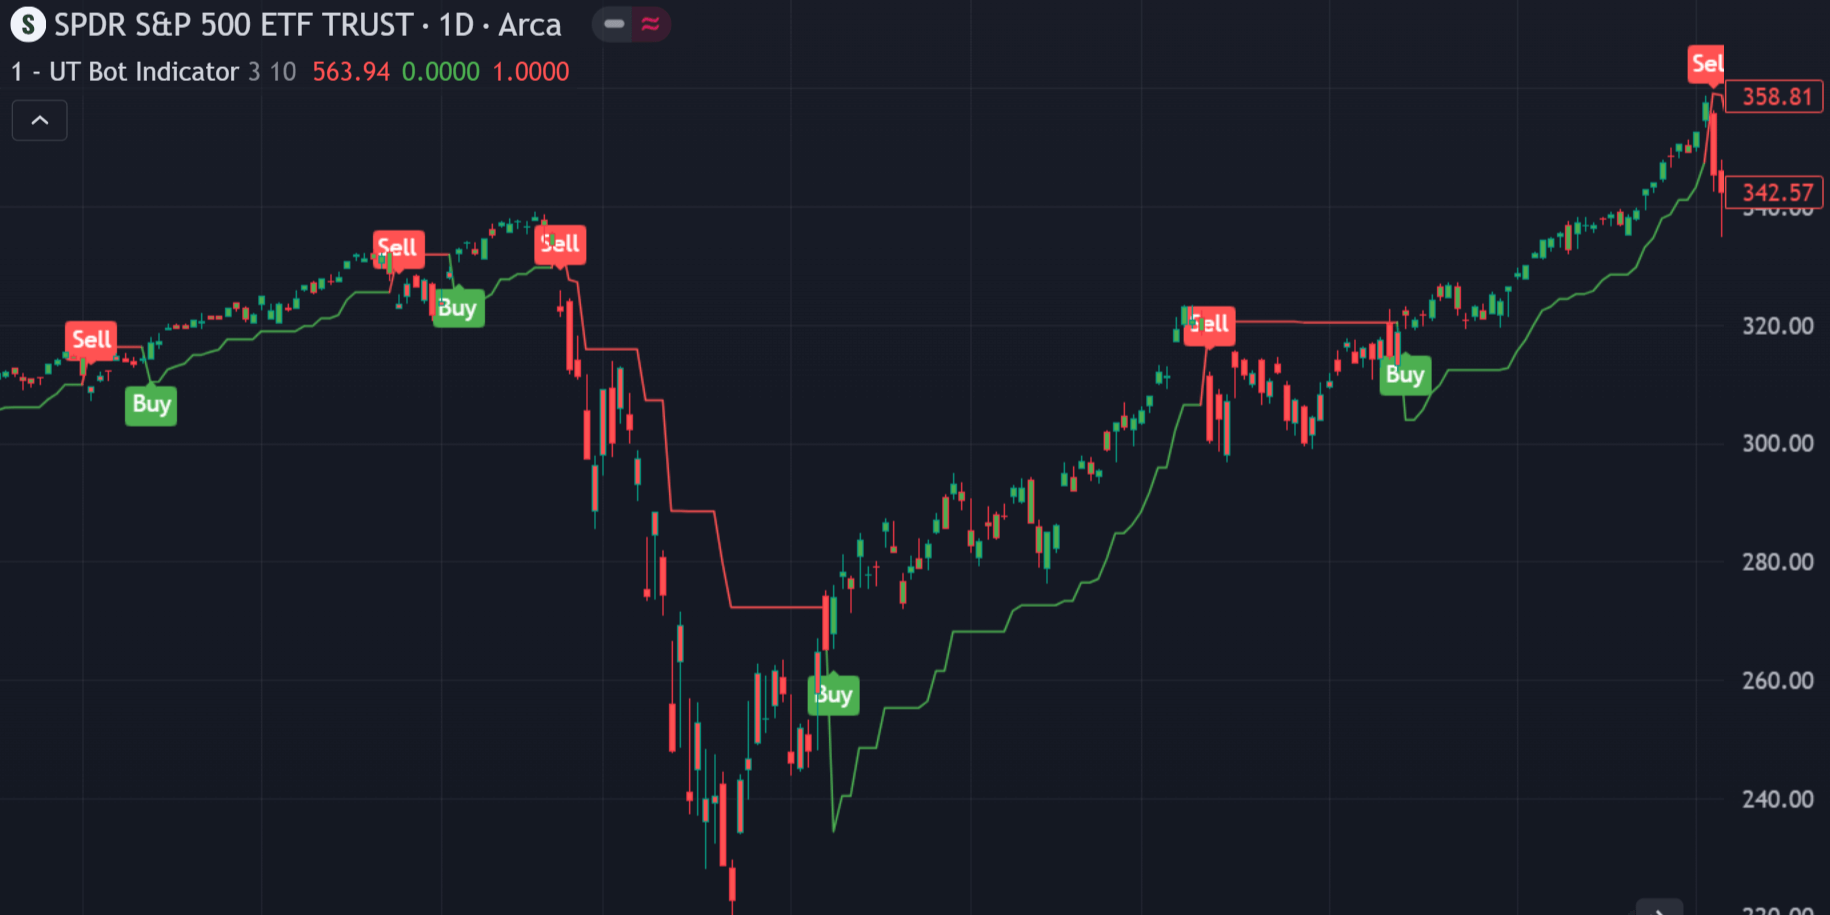
The UT Bot is a trend-following trading indicator, our the team at algoHunt modified the code into a strategy in order to backtest it and ...
More Details >

Backtest | UT Bot

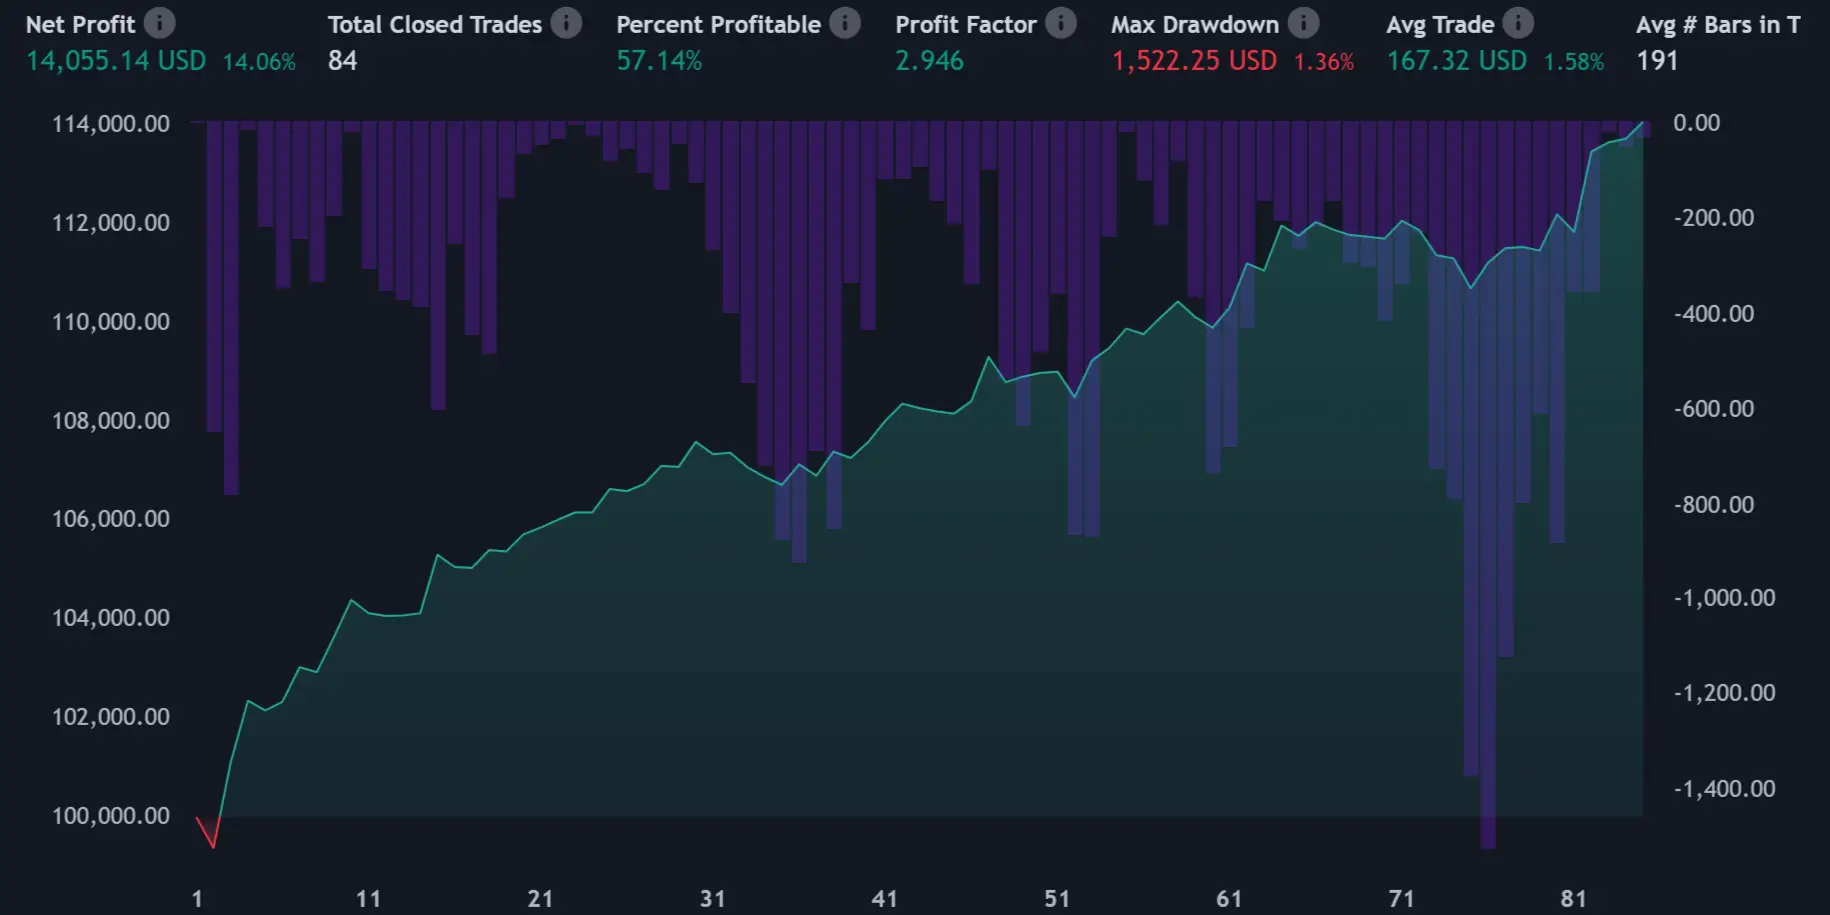
For the UT Bot strategy, we conducted tests on four distinct timeframes: 1 minute, 1 hour, 1 day, and 1 week. Each timeframe was tested ...
More Details >
Scroll to Top