Strategy

UT Bot

The UT Bot is a trend-following trading indicator, the team at algoHunt modified the code into a strategy in order to backtest it and analyze the performance. This article will delve into the logic behind the UT Bot strategy, and in our backtest report we explore its performance on different timeframes, trading hours and settings.

*UT Bot strategy applied to a 1-minute chart of the SPDR S&P 500 ETF (SPY)

Overview

The UT Bot Strategy uses the Average True Range (ATR) as a core component to determine the trailing stop levels, which form the basis for identifying bullish and bearish signals. The ATR helps in capturing the market’s volatility, allowing the strategy to adapt dynamically to changing market conditions.

Key Parameters

  • Key Value: This parameter controls the sensitivity of the strategy. A higher value makes the strategy less sensitive to price movements, reducing the frequency of trades.
  • ATR Period: Determines the lookback period for calculating the ATR, which influences the trailing stop levels.

The strategy determines the trend by comparing the closing price with the trailing stop. If the closing price is above the trailing stop, the strategy considers the market to be in a bullish phase; if it’s below, a bearish phase is assumed.

*UT Bot strategy applied to a 1-day chart of the SPDR S&P 500 ETF (SPY)

The arrows mark the entry or exit:

  • LE for long entries, SS_E for short entries
  • LX for long exits, SS_X for short exits
*Settings

Notes

The UT Bot Strategy is versatile and can be adapted to different trading styles by adjusting the key value and ATR period. Traders can optimize these parameters based on their risk tolerance and the asset’s volatility. For instance, a lower key value would increase the number of trades, potentially capturing more minor price movements, while a higher value would focus on more significant trends.

The UT Bot Strategy, built on the reliable ATR indicator, offers a systematic approach to trading across various timeframes. Its adaptability and clarity make it a valuable tool for traders looking to automate their strategies in TradingView. By fine-tuning the strategy’s parameters, traders can align the UT Bot with their unique trading goals, whether for day trading or longer-term trend following.

See below for links to the indicator version of this strategy or see the backtest results of multiple timeframes and settings. 

Resources

Research, Plan and Trade with algoHunt

Sign up today to get new strategy notifications & free access to the backtest library.

Indicator & Backtesting

Visualize this strategy on TradingView using the indicator. We also backtest it to get an idea of performance.

Indicator | UT Bot

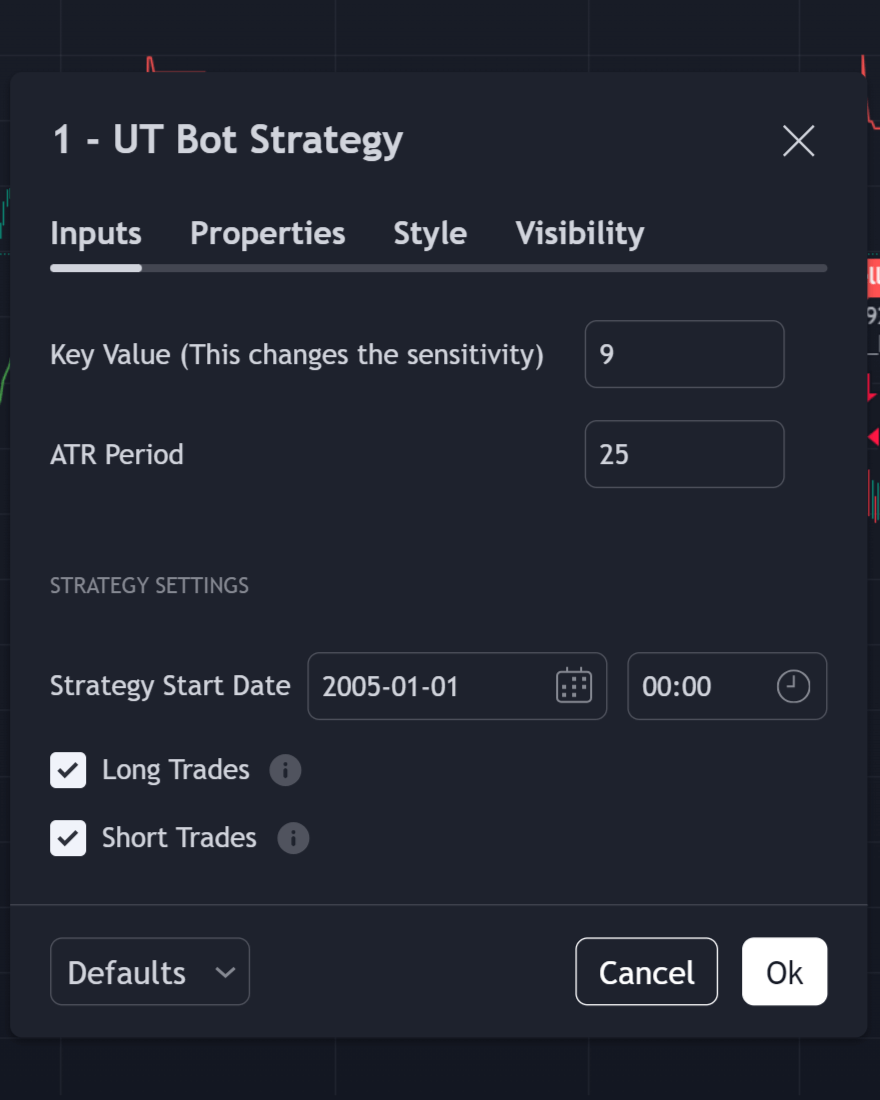
The UT Bot indicator is a powerful tool that aids traders in identifying potential buy and sell signals based on the Average True Range (ATR) ...
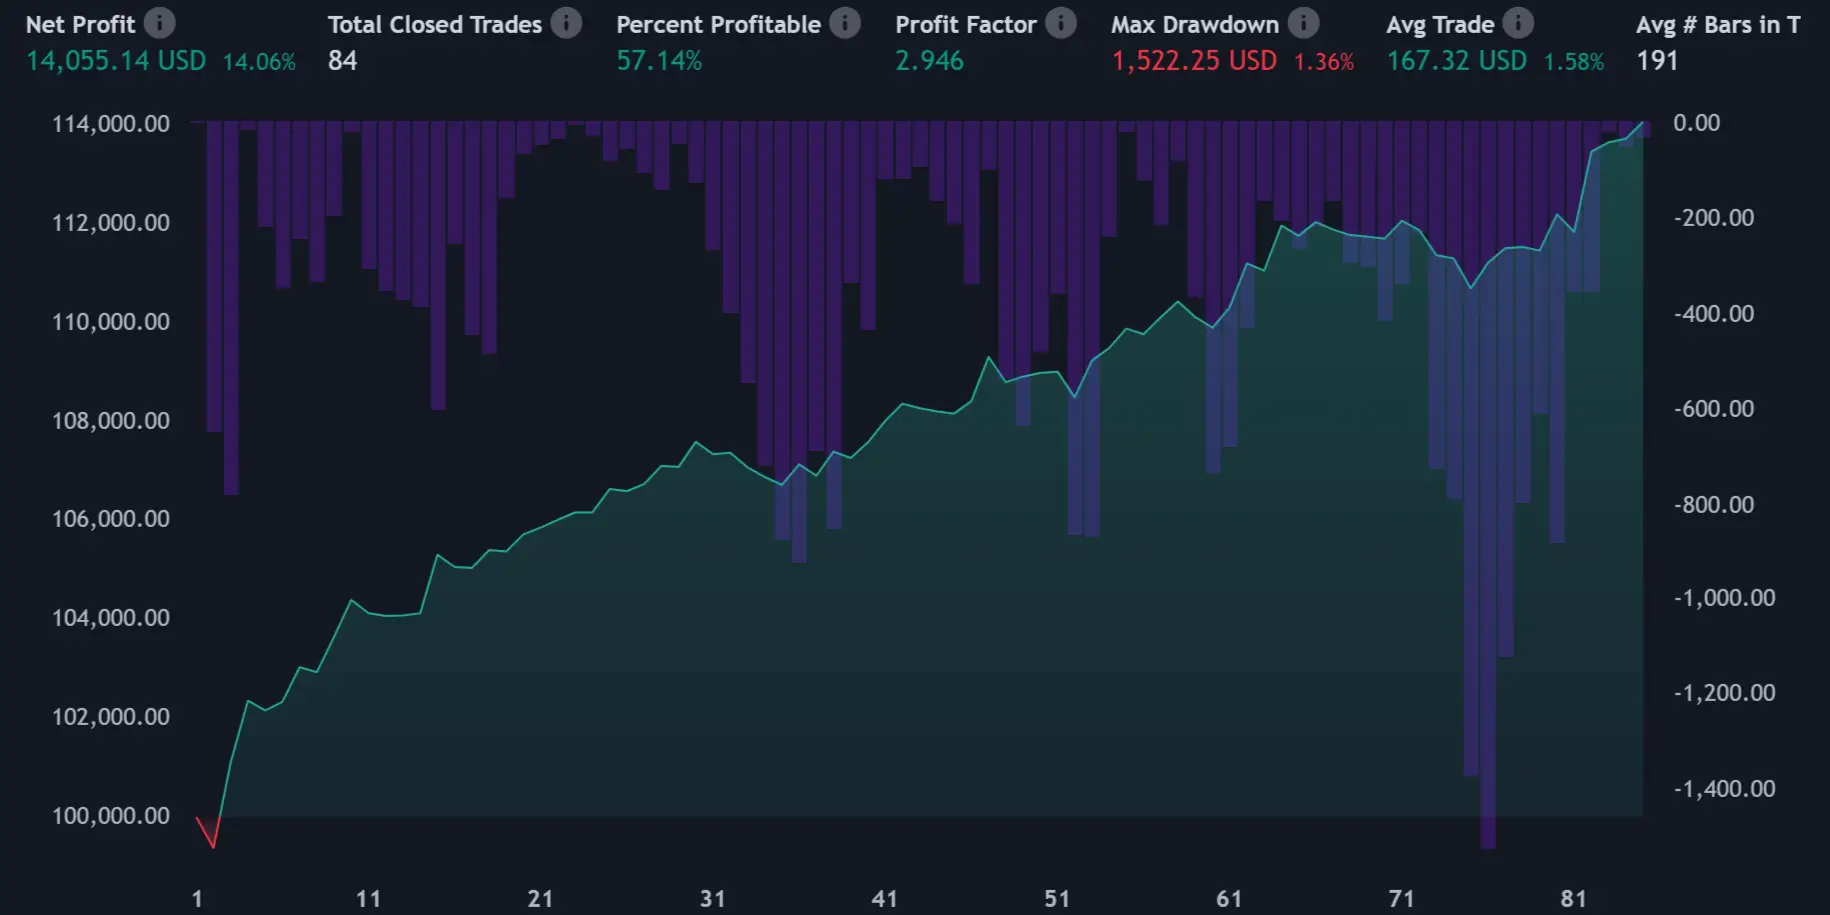
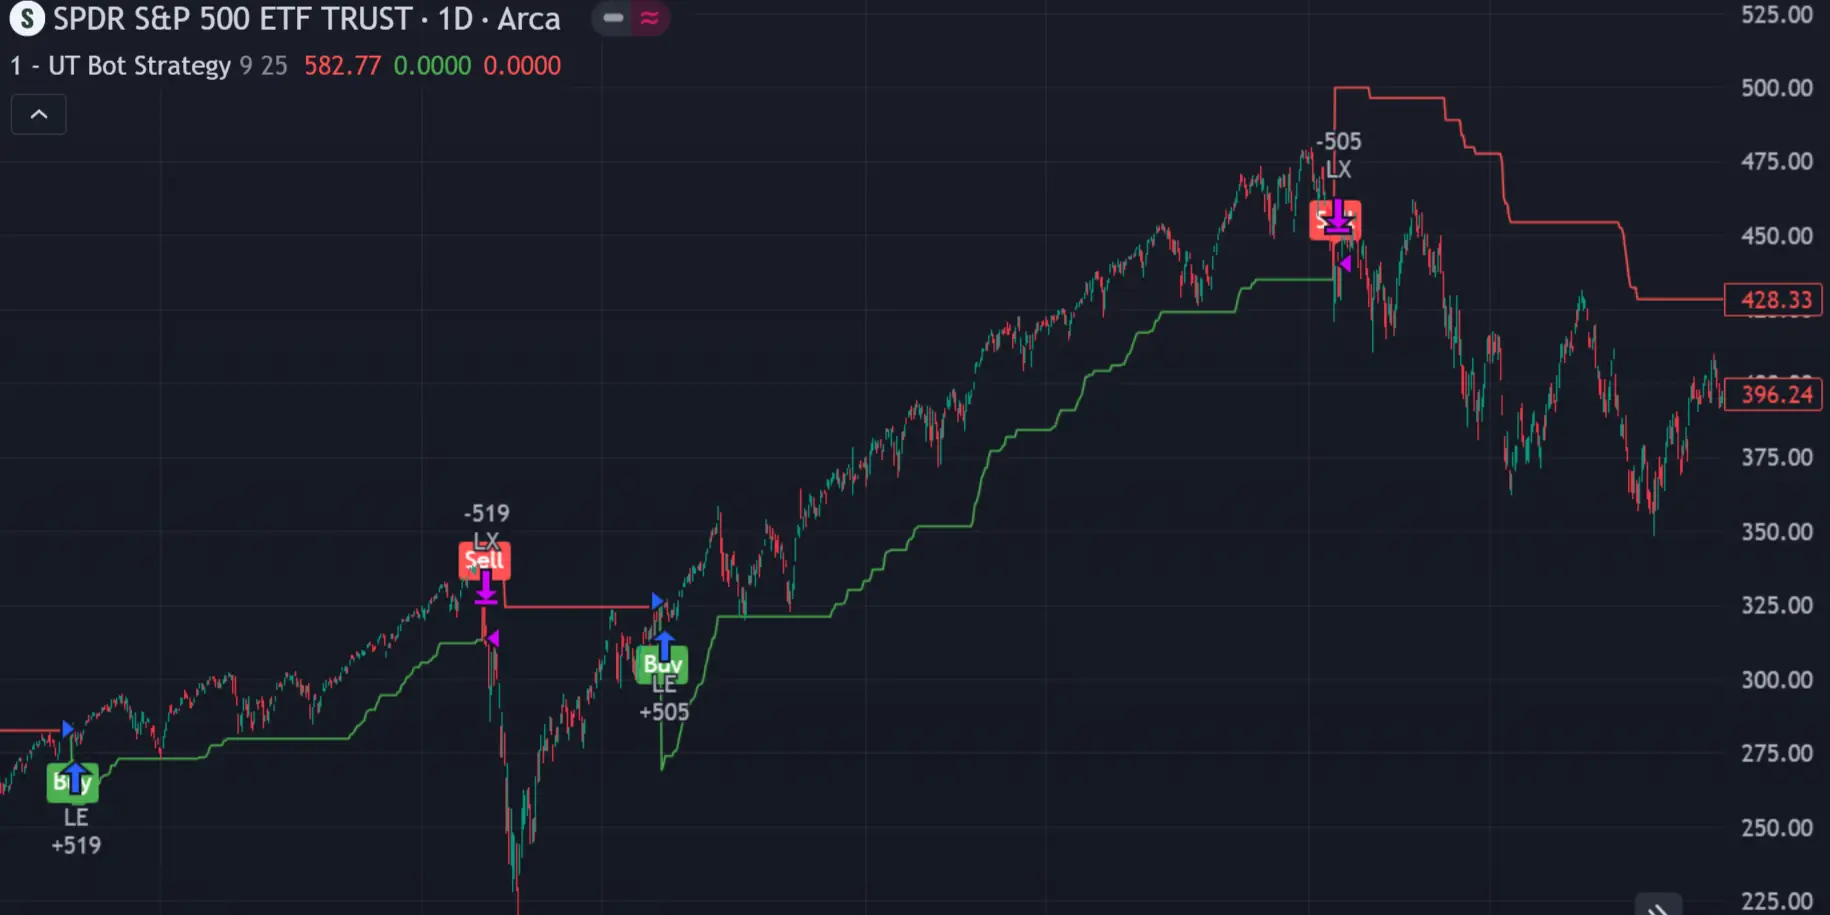
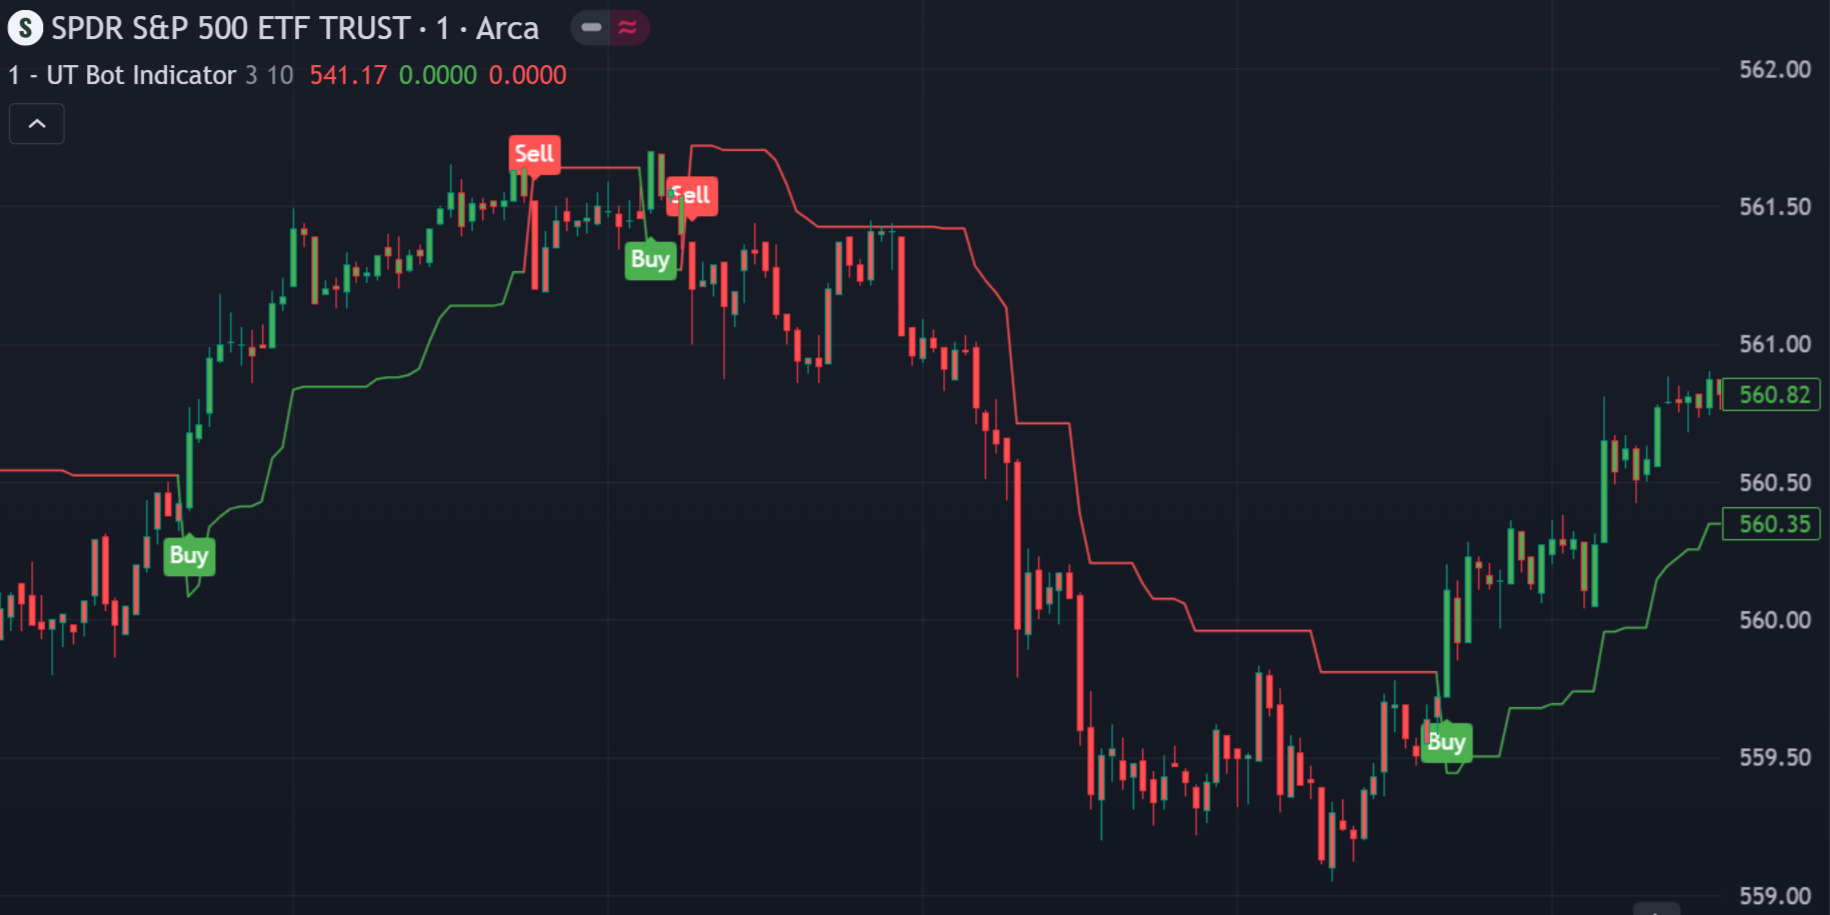
More Details >

Backtest | UT Bot

For the UT Bot strategy, we conducted tests on four distinct timeframes: 1 minute, 1 hour, 1 day, and 1 week. Each timeframe was tested ...
More Details >
Scroll to Top